EMODnet Chemistry: New marine litter maps online
")
The latest version of the maps visualising the spatial and temporal distribution of marine litter is available on the EMODnet map viewer. This version contains for the first time 16 maps for floating microlitter in all European sea basins and beyond. These data products are based on the latest data collections published in 2023, as described in a recent EMODnet webnews. Using animations, these products show the distribution of 1) net location and mesh size used, 2) microlitter density per net and 3) type, size and colour of litter per net over the years. There are two subcategories of maps that differ from the protocols used for data collection: Research and monitoring protocols or other specific protocols. Based on data from research and monitoring programmes, two additional maps have been created that allow the user to visualise the transparency of litter per net and the spatial distribution of litter density, normalised per km2.
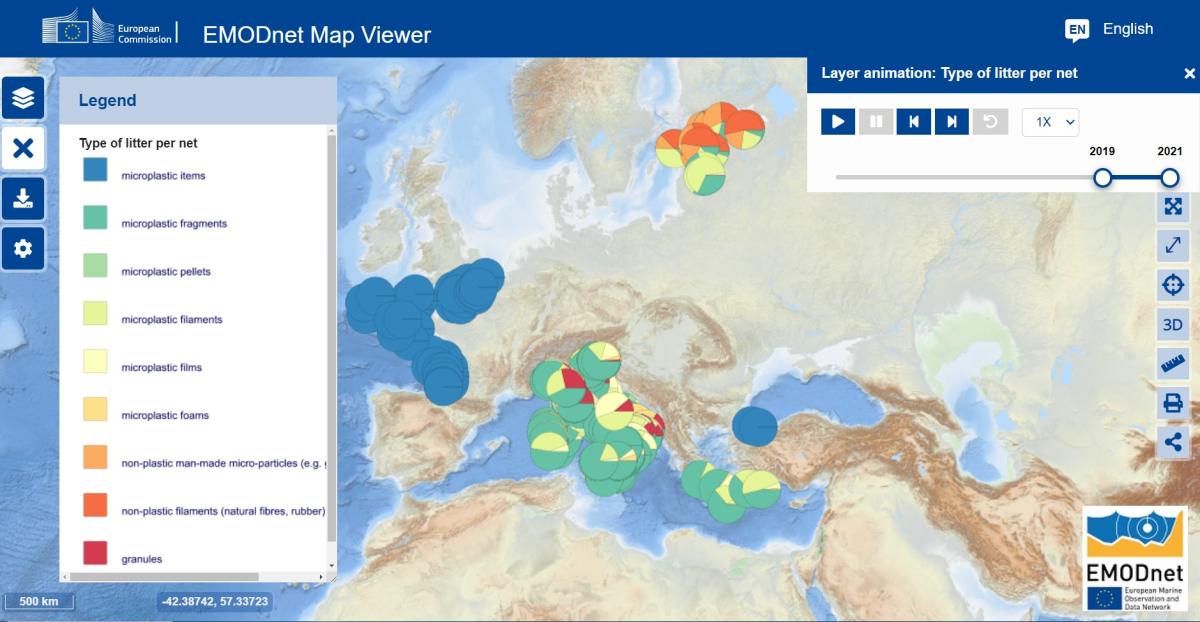
Example of floating microlitter map: Type of litter per net (©EMODnet Chemistry)
EMODnet Chemistry started managing marine litter data in 2017. Since then, the partnership has regularly published data collections and maps for beach litter and seafloor litter. For these data types, the existence and adoption of consolidated protocols has led to the implementation of a centralised data flow. In 2023, the maps based on the centralised database were updated and three new maps for seafloor litter were published. Currently, 18 beach litter maps and 8 seafloor litter maps can be viewed via the EMODnet central portal. Regarding beach litter, the maps are divided into two sub-categories depending on the data source, i.e. official monitoring and other monitoring sources. The different data products provide information on 1) locations and reference list used, 2) number of surveys and temporal coverage, 3) composition of litter by category, 4) abundance of litter per 100m and per beach, 5) median number of key categorised items per 100m and per beach. For seafloor litter, the maps are 1) trawl locations, 2) litter composition by category, 3) litter density per trawl, normalised per km2 , 4) density of key items normalised per km2, 5) spatial distribution of litter density, normalised per km2 .
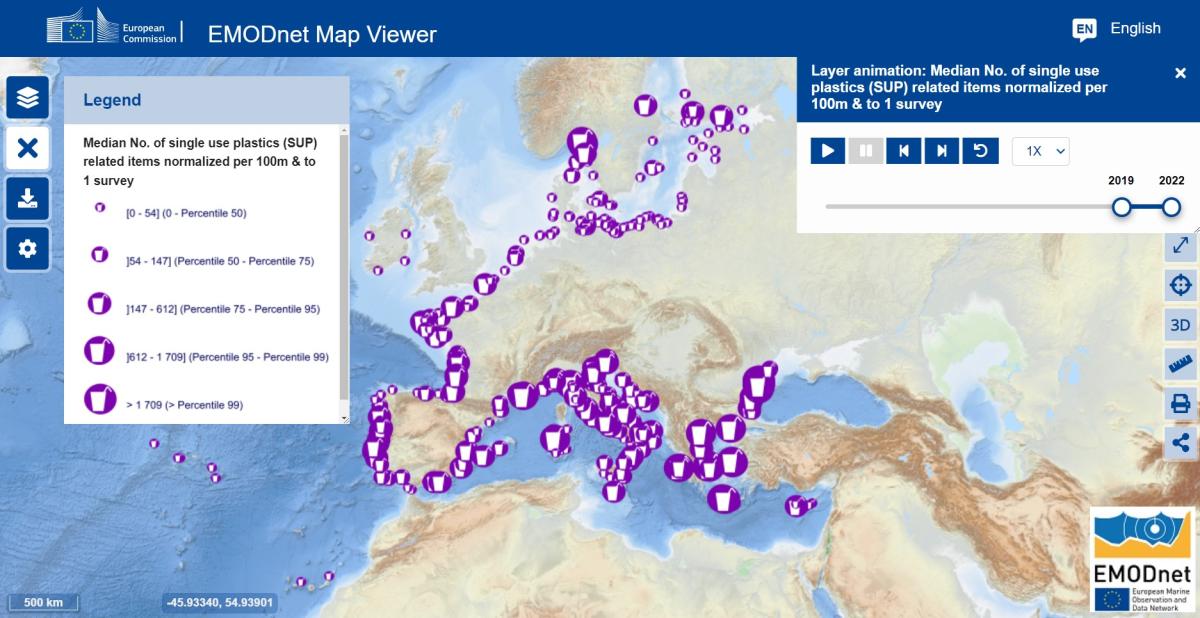
Example of Beach litter map: Median No. of single use plastics (SUP) related items normalised per 100m & to 1 survey (©EMODnet Chemistry)
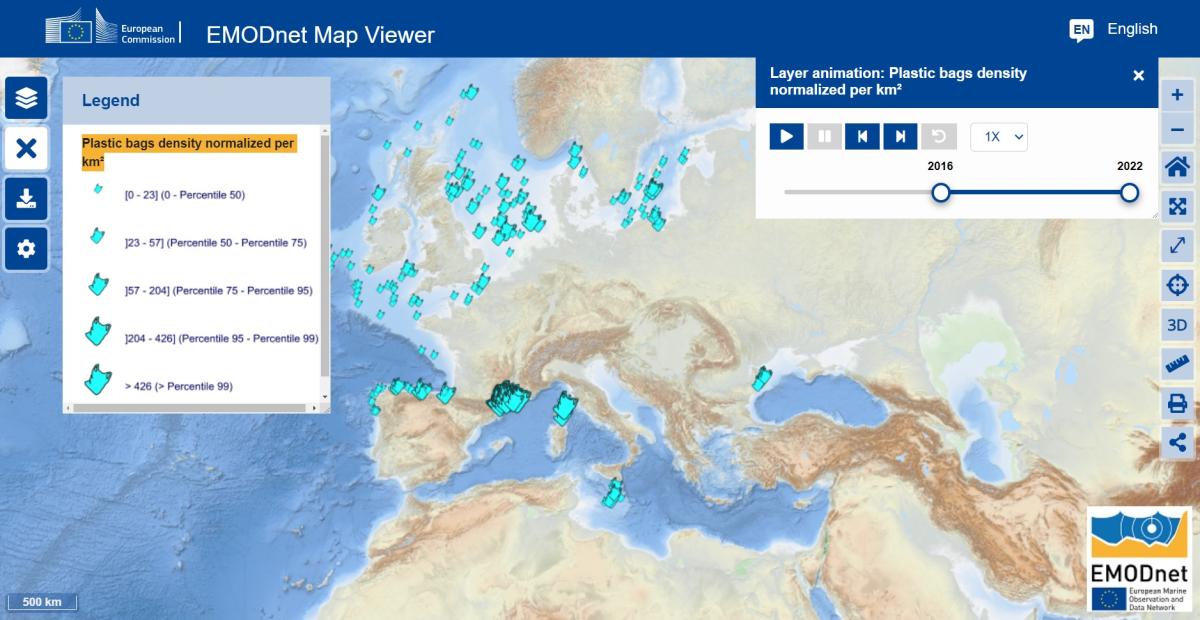
Example of seafloor litter map: Plastic bags density normalised per km² (©EMODnet Chemistry)
Before 2021, there were no coordinated efforts at regional or European level for microlitter. For this reason, there were also no generally recognised protocols, resulting in a rather fragmented and heterogeneous management system. Given this situation, the standards and distributed data flow of SeaDataNet, involving the national oceanographic data centres, were used to collect data on floating microlitter and in sediment. In addition, specialised SeaDataNet data transport formats have been developed.
The new maps for marine litter were discussed with the MSFD board of experts during a meeting to go over the process used to create the data products, including the quality assurance and quality control steps. The opinions and questions of the MSFD Board experts were sought to ensure that EMODnet Chemistry is aligning its data management and data products with user needs and keeping the experts informed of developments. The experts agreed that quality control procedures and a trusted source are the most important aspects of working with marine litter data.
Explore the maps in the EMODnet map viewer and find out more in the EMODnet data products catalogue.