Map of the Week - Employment in marine fisheries, aquaculture and processing
European Union (EU) citizens on average consume about 24 kg of seafood per year.[1] The EU accounts for about 3.3 % of global fisheries and aquaculture production. [2] It is the fifth largest producer worldwide. At the EU level, 80 % of the production comes from fisheries and 20 % from aquaculture. Fishing plays a crucial role in employment and economic activity in several EU regions and aquaculture employs about 75,000 people.[2] The processing industry consists of approximately 3,500 companies.[2] EU production mainly concerns canned products and ready meals consisting of fish, crustaceans and molluscs.
The European Farm to Fork Strategy, a key component of the Green Deal, aims to reduce the environmental and climate footprint of the food system and strengthen its resilience, ensure food security in the face of climate change and biodiversity loss and lead a global transition towards competitive sustainability from farm and sea to fork, tapping into new opportunities. The strategy will address each and every step of the food chain, from production and processing, to distribution, marketing, consumption and international trade.[1] Stakeholders in all related sectors are key in this transition. For example, through FARNET, Fisheries Local Action Groups (FLAGs), public authorities, citizens and experts from across the EU can work together on the sustainable development of fisheries and coastal areas.
Wish to know more on marine fisheries, aquaculture and processing?
- Watch the Euronews ocean episodes on aquaculture and sea to plate;
- Find further information on the European Market Observatory for fisheries and aquaculture (EUMOFA) website;
- Discover the work of the Working Group on Food from the Ocean that has been set up within the framework of the EU4Ocean Platform and find out how to apply to become a member of the EU4Ocean Platform;
- Learn about BlueInvest Day 2021 which will take place on 26 January 2021;
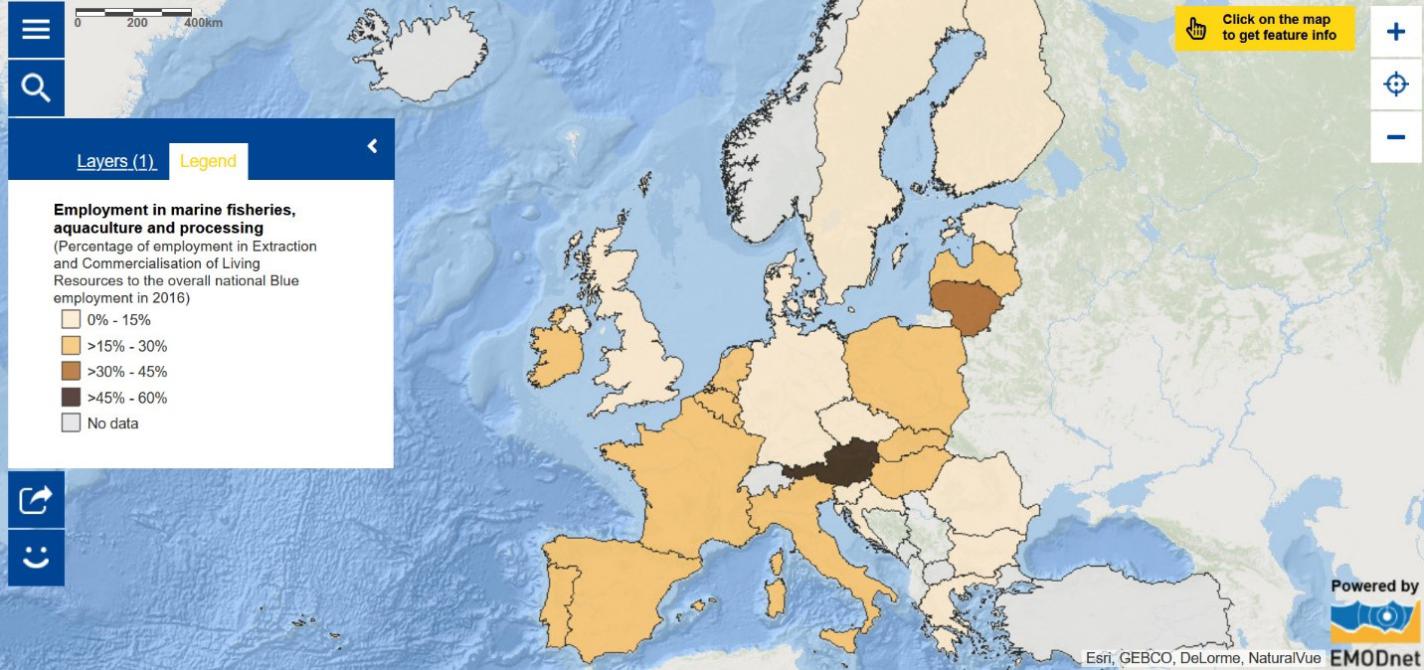
- Explore the Map of the Week to learn about employment in marine fisheries, aquaculture and processing. The map displays the percentage of people working in the sector compared to the overall employees in the blue economy per Member State. In each country, you can find information regarding the employment in each sub-sector (aquaculture, capture fisheries, processing and distribution), the evolution of the overall employment in marine living resources since 2009 and the exact number of persons employed in the sector each year.
The data in this map are provided by the European Commission's Directorate-General for Maritime Affairs.
[2] https://ec.europa.eu/fisheries/sites/fisheries/files/docs/body/pcp_en.pdf