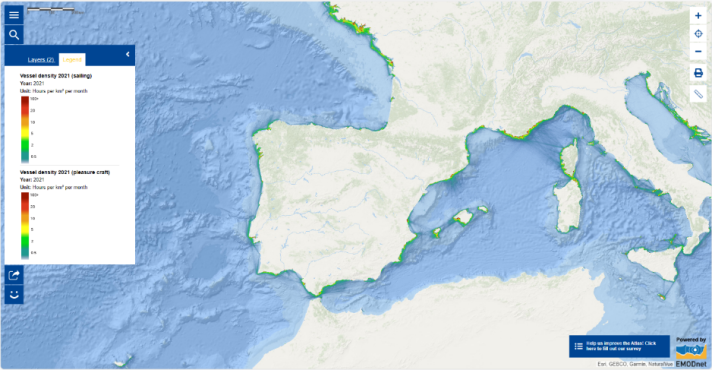
Map of the Week – Vessel density and sustainable nautical tourism

As we navigate towards a new era of watersports and coastal and marine tourism, boot Düsseldorf , the world’s largest yacht and watersports show, emerges as a dock of blue innovation and technologies that allows the boating industry to embark on a journey towards innovative horizons and sustainable seas. On 20-28 January, boot 2024 is expected to attract up to 250,000 visitors in Düsseldorf, Germany. This international trade fair is renowned for showcasing a comprehensive range of watersports and marine leisure activities. Meanwhile, it is also a stage for ocean enthusiasts to promote sustainable development and ocean literacy.
In the thrilling world of watersports, where every wave carries the promise of adventure, clean water stands as the radiant gem that fuels our aquatic passion. At boot Düsseldorf 2024, the "love your ocean " initiative, in partnership with Deutsche Meeresstiftung , will be presenting how industry, science and society can protect the ocean and the climate. Another key highlight of boot 2024 is its new sustainability forum, the blue innovation dock (bid ), co-organised by the European Boating Industry (EBI ). Bid is an international networking platform for industry, policymakers and the watersports community to exchange ideas on how to ensure a sustainable development of the boating industry.
Wish you could visualise vessel density on a map? The map of this week shows the maritime traffic on the European seas in 2021 for both sailing and pleasure craft. The European seas are a major hub of maritime traffic. Understanding the patterns of vessel traffic is essential for effective marine spatial planning, particularly in the context of planning offshore wind energy parks, subsea cables and pipelines. This knowledge is crucial for assessing the impact of various human activities, such as fishing and offshore construction, on marine ecosystems. On the map, the vessel density is expressed as the number of hours per month that ships spent in each square kilometre. The data was calculated from a large dataset of Automatic Identification System (AIS) messages, which contain the ship locations transmitted by on-board transponders. This was done using a novel big data analysis workflow developed by EMODnet Human Activities.
Wish to know more?
- Find out about key highlights at boot 2024.
- Read about the Environaut project, which aims to increase environmental awareness and facilitate environmental protection within the nautical tourism sector. At the bid at boot Düsseldorf 2024, the new Environaut Environmental Officer Course will be launched!
- Revisit the past Map of the Week on Developing Skills for the Blue Economy.
Did you know that a number of watersports organisations are on board the EU4Ocean Platform? The EU4Ocean Platform is a dynamic community of organisations, initiatives, and individuals united by their passion for ocean literacy, who are committed to crafting a sustainable ocean legacy for generations to come. Learn more about the objectives and activities of the EU4Ocean Platform, the Youth4Ocean Forum and the Network of European Blue Schools on the dedicated websites and find out how you can join the EU4Ocean communities!
The data in this map are provided by EMODnet.
