Map of the Week – Global mean sea level regional trend
On Monday, the Intergovernmental Panel on Climate Change (IPCC) held a press conference to present the ‘Summary for Policymakers’ of the Working Group I contribution to the Sixth Assessment Report, Climate Change 2021: The Physical Science Basis. The report shows that emissions of greenhouse gases from human activities are responsible for approximately 1.1°C of warming since 1850-1900, and finds that averaged over the next 20 years, global temperature is expected to reach or exceed 1.5°C of warming. [1] The press release states that unless there are immediate, rapid and large-scale reductions in greenhouse gas emissions, then limiting warming to close to 1.5°C or even 2°C – the objective set in the Paris Agreement - will be beyond reach. But the report also shows that human actions still have the potential to determine the future course of our climate. There is a clear need to significantly step up climate action.
With regard to the ocean and coastal areas, the IPCC notably states that:
- Changes to the ocean, including warming, more frequent marine heatwaves, ocean acidification, and reduced oxygen levels have been clearly linked to human influence. These changes affect both ocean ecosystems and the people that rely on them, and they will continue throughout at least the rest of this century. [1]
- Coastal areas will see continued sea level rise throughout the 21st century, contributing to more frequent and severe coastal flooding in low-lying areas and coastal erosion.Extreme sea level events that previously occurred once in 100 years could happen every year by the end of this century. [1]
- Many changes due to past and future greenhouse gas emissions are irreversible for centuries to millennia, especially changes in the ocean, ice sheets and global sea level. [2]
The Regional Factsheet about the ocean summarizes key findings and presents projections for sea surface temperature, sea level rise, pH at surface and sea ice concentration change resulting from simulations using climate models. The Regional Factsheet for Europe states that regardless of level of global warming, relative sea level will rise in all European areas except the Baltic Sea, at a rate close to or exceeding global mean sea level. Changes are projected to continue beyond 2100. Extreme sea level events will become more frequent and more intense, leading to more coastal flooding. Shorelines along sandy coasts will retreat throughout the 21st century.
A new tool made available with the new IPCC report- the IPCC Interactive Atlas – makes it possible to see how different variables, including sea level rise, could evolve in the near-term, medium-term and long-term depending on the different scenarios analysed ranging from very low CO2 emissions to very high CO2 emissions.
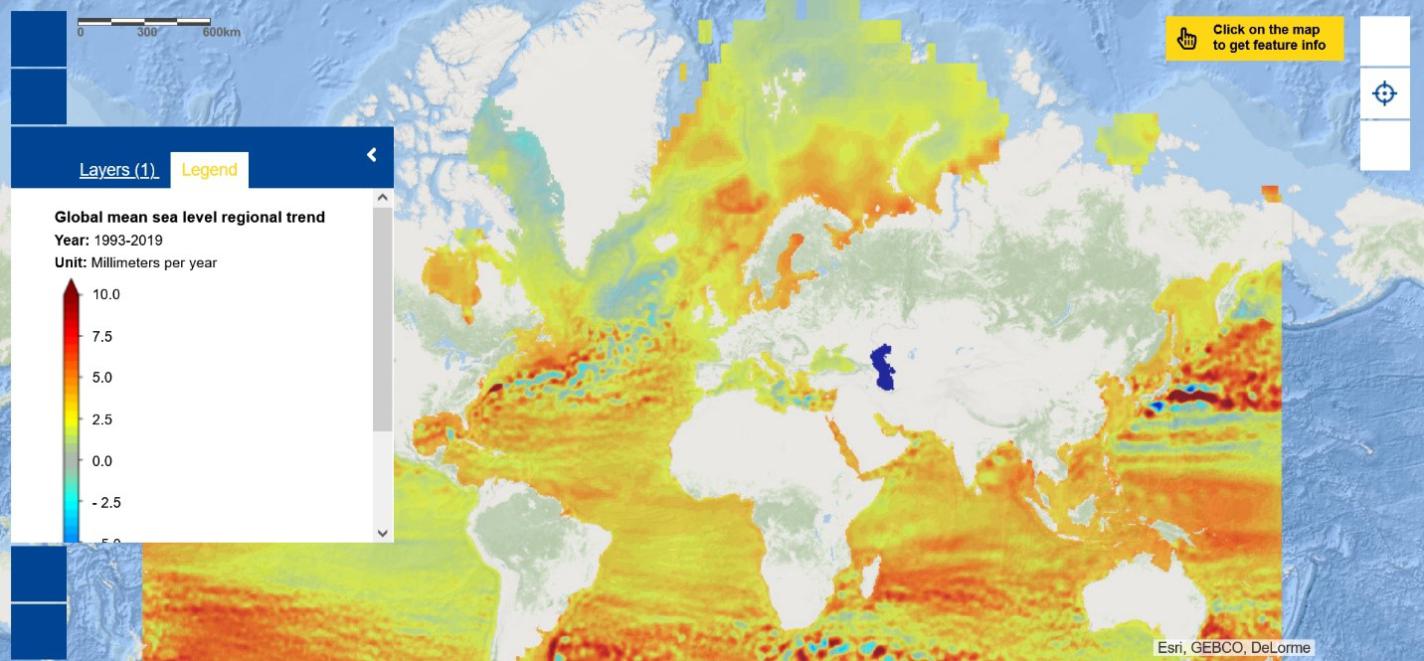
Explore the Map of the Week to learn about the spatial distribution of sea level trends between 1993 and 2019. How this map will evolve in the coming years - how much sea levels will rise - depends on us and on our actions to reduce greenhouse gases emissions. The IPCC report and the IPCC Interactive Atlas provide key information that shows the impacts that reductions in greenhouse gas emissions can have. It also provides important insight for risk assessment and climate change adaptation.
What can you do?
- Learn about the European Climate Pact and identify what you can do to reduce greenhouse gas emissions;
- Search the Climate-ADAPT website to learn more about climate change adaptation, identify how climate change could impact you and how you could adapt to these changes;
- Learn about the activities of the EU4Ocean Coalition and join its members to work on Ocean Literacy. Participate in the ‘Make Europe Blue’ campaign and submit your pledge for the ocean. Take part in the EU4Ocean Ocean Literacy Baltic Sea-Basin Event on 26-27 August 2021 and the EU4Ocean Ocean Literacy Mediterranean Sea basin event on 24-27 September 2021 to learn about these sea-basins.
The data in this map are provided by Copernicus Marine Service.
[1] https://www.ipcc.ch/site/assets/uploads/2021/08/IPCC_WGI-AR6-Press-Release_en.pdf
[2] https://www.ipcc.ch/report/ar6/wg1/downloads/report/IPCC_AR6_WGI_Headline_Statements.pdf