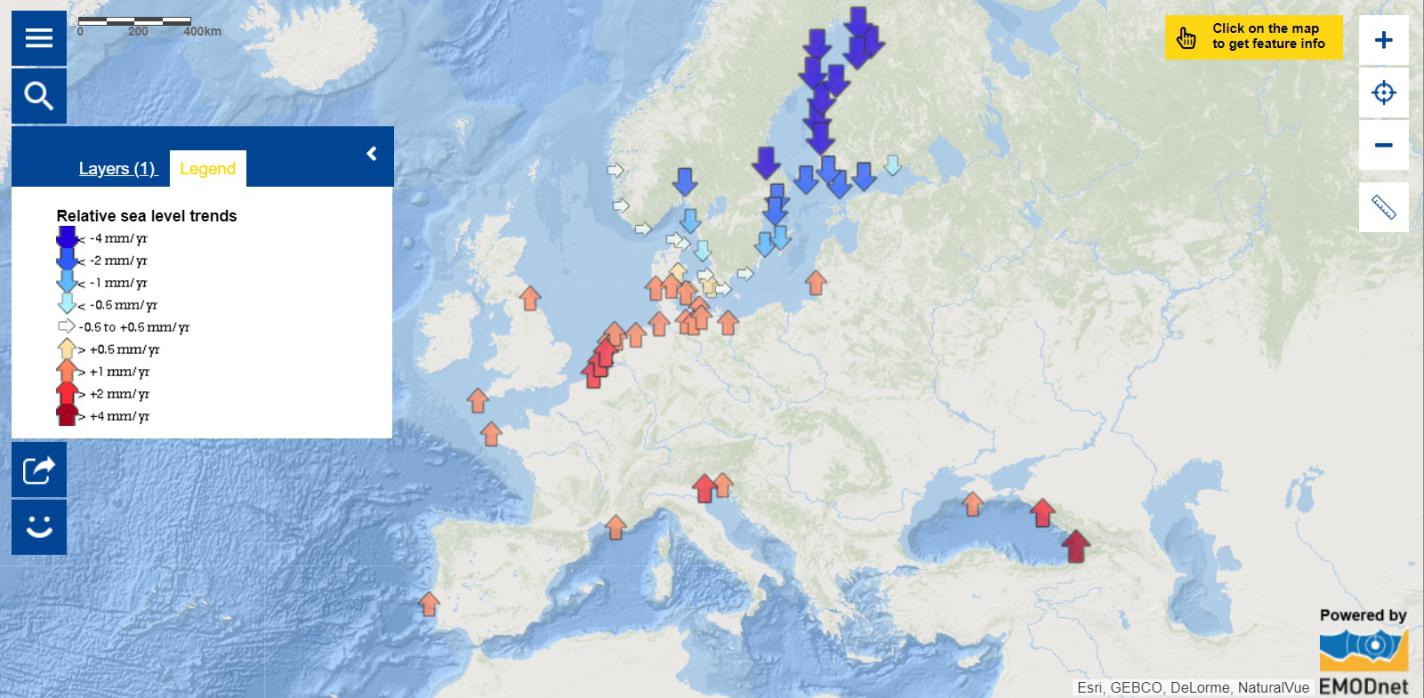
Map of the week – Relative sea level trends

One of the main impacts of climate change on coastal societies is sea level rise (IPCC Fifth Assessment Report). Since 1993, the global average sea level has increased by 3.3 (± 0.4) millimetre per year due to the melting of glaciers and polar ice caps as well as the thermal expansion of the ocean water (Copernicus Climate Change Service). Regional sea level change however, varies greatly as it also depends on a range of geophysical processes like ocean circulation changes, regional water density changes and vertical movements of the land (IPCC Fifth Assessment Report).
The map of this week shows the change in sea level (in millimetre per year), relative to the land, along the European coasts. Note that along the Atlantic, Mediterranean, North and Black Sea coasts, sea levels are rising. In contrast, sea levels are falling along many of the Baltic Sea coasts as in this region the land is rising. This rise is caused by the slow rebound of the earth’s crust following the removal of large ice sheets during the deglaciation 10,000 years ago. Learn how sea level rise will affect your coast!
The data in this map were provided by EMODnet-physics
