 EMODnet Product Catalogue
Type of resources
Available actions
Topics
Keywords
Contact for the resource
Provided by
Years
Formats
Representation types
Update frequencies
status
Service types
Scale 1:
Resolution
-
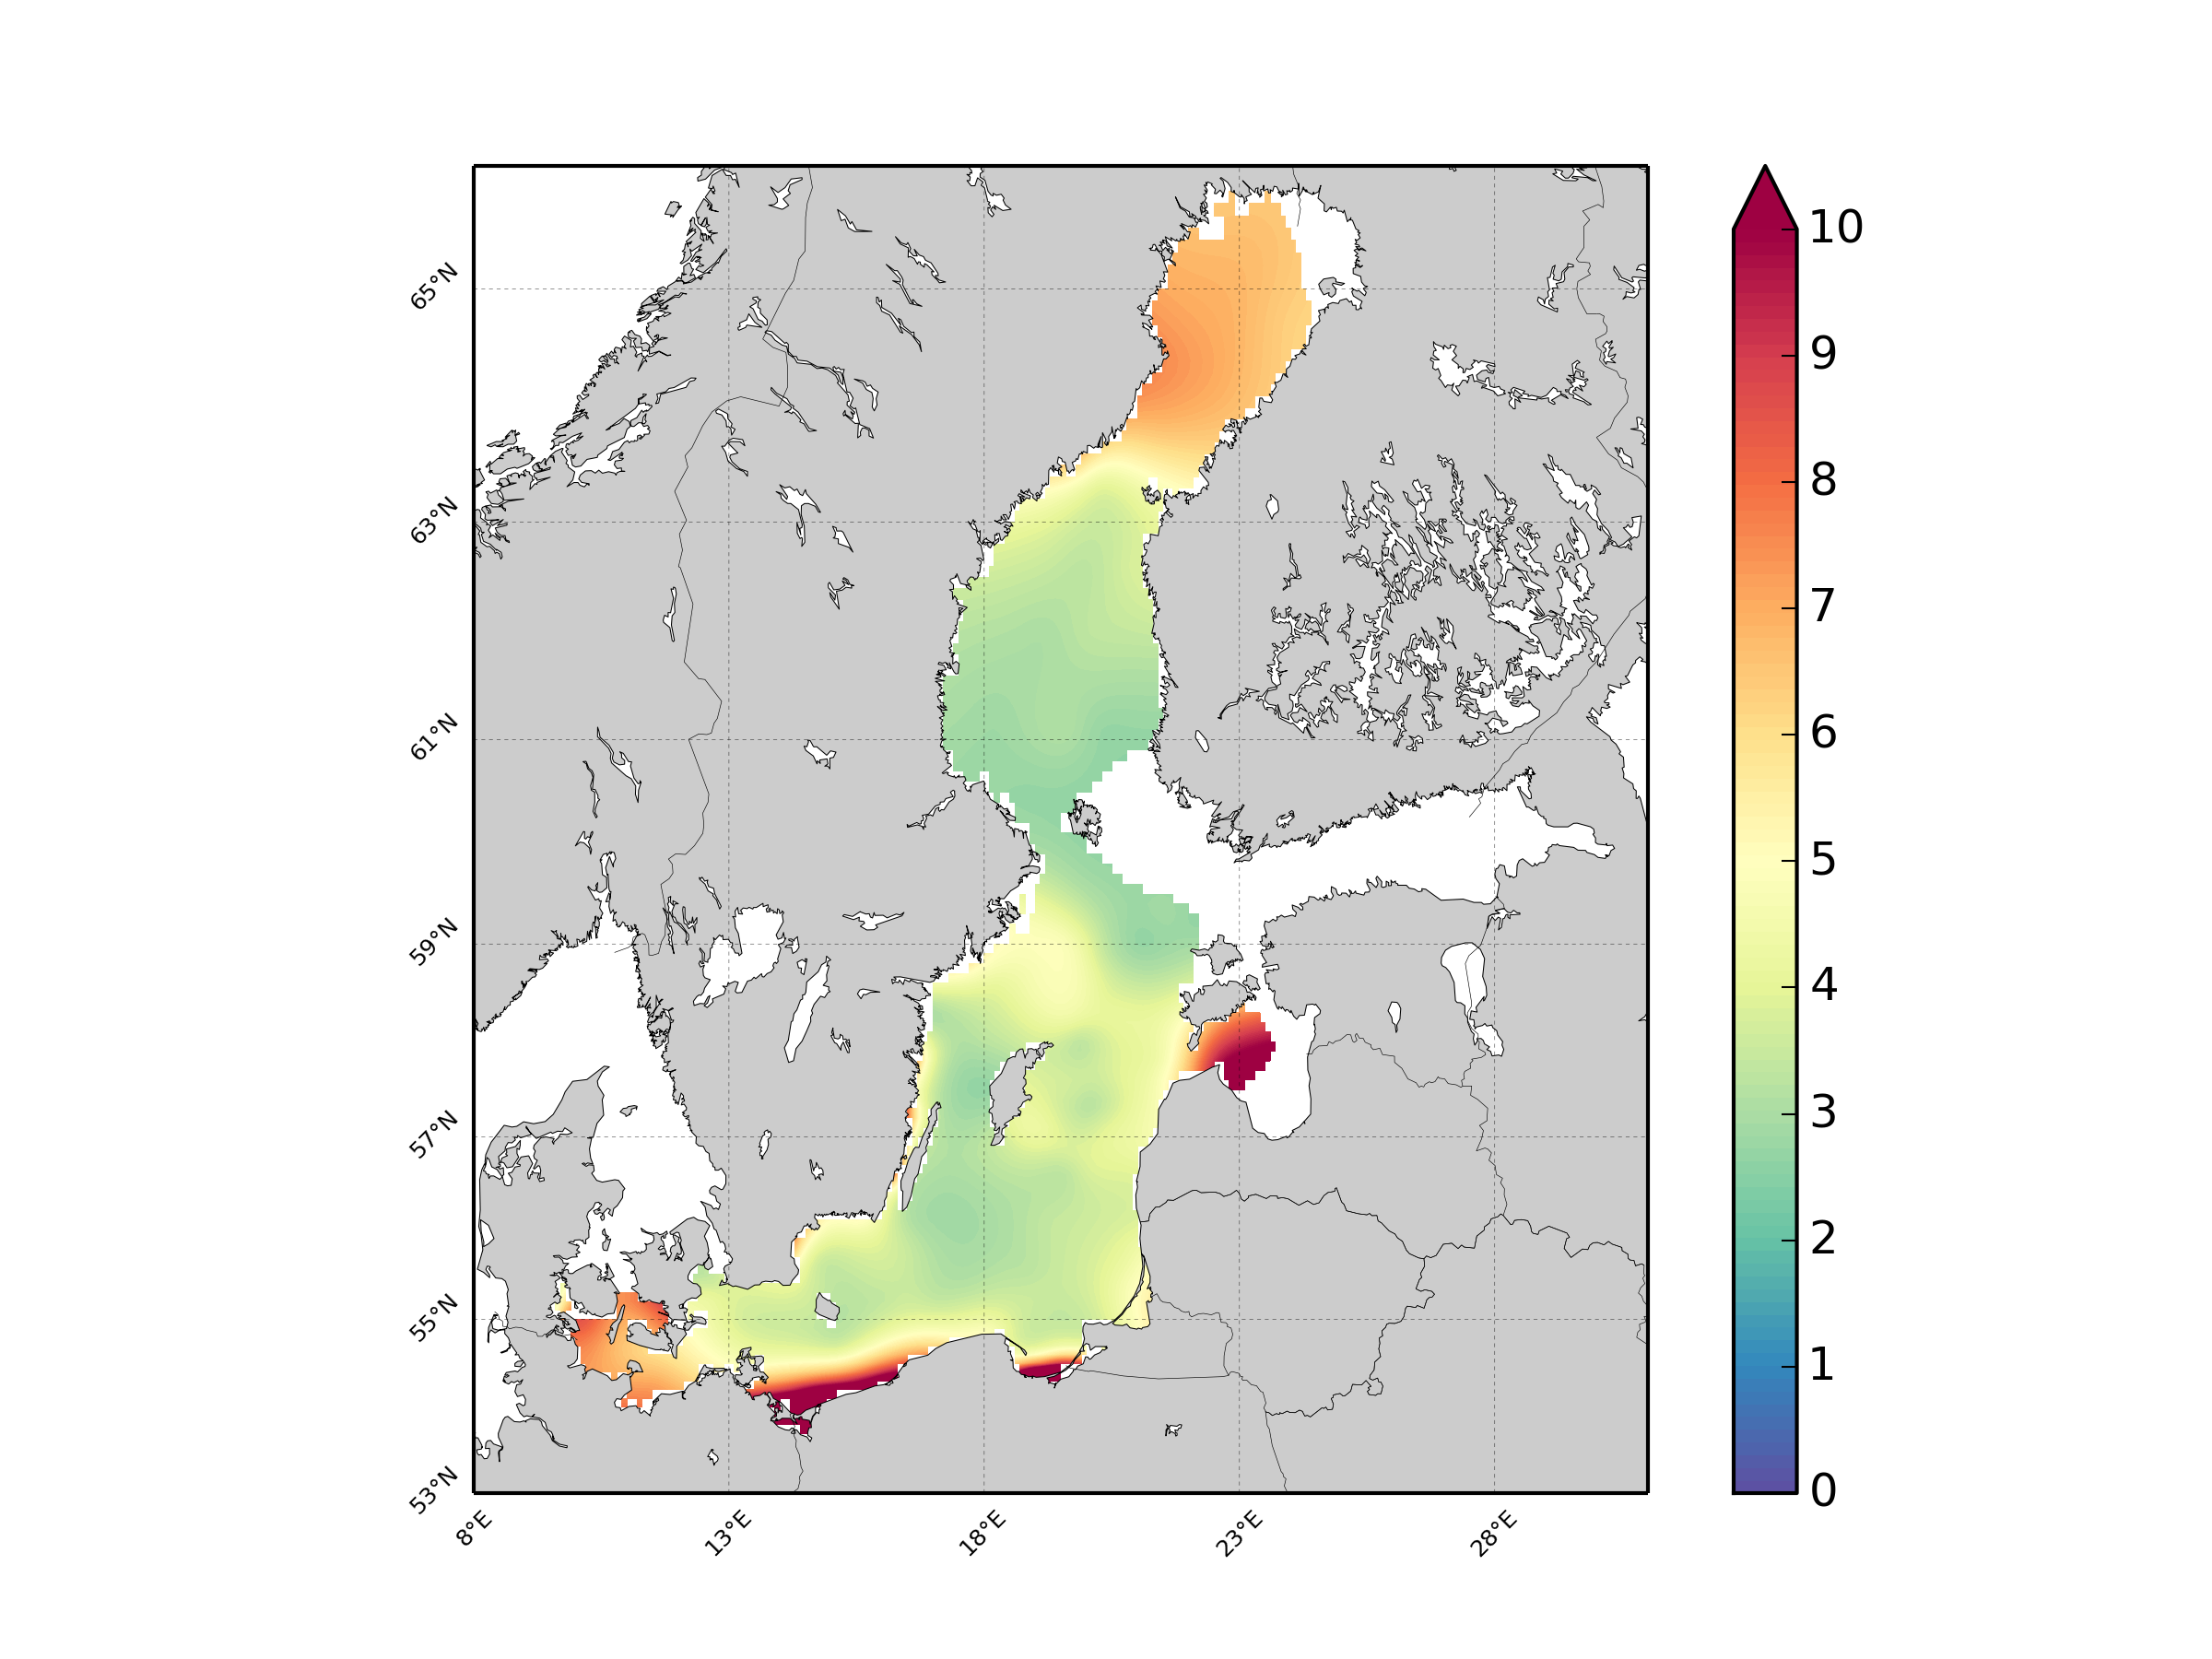
Units: umol/l. Method: spatial interpolation produced with DIVA (Data-Interpolating Variational Analysis). URL: http://modb.oce.ulg.ac.be/DIVA. Comment: Every year of the time dimension corresponds to a 10-year centred average for each season : - winter season (December-February), - spring (March-May), - summer (June-August), - autumn (September-November). Diva settings: Snr=1.0, CL=0.7
-
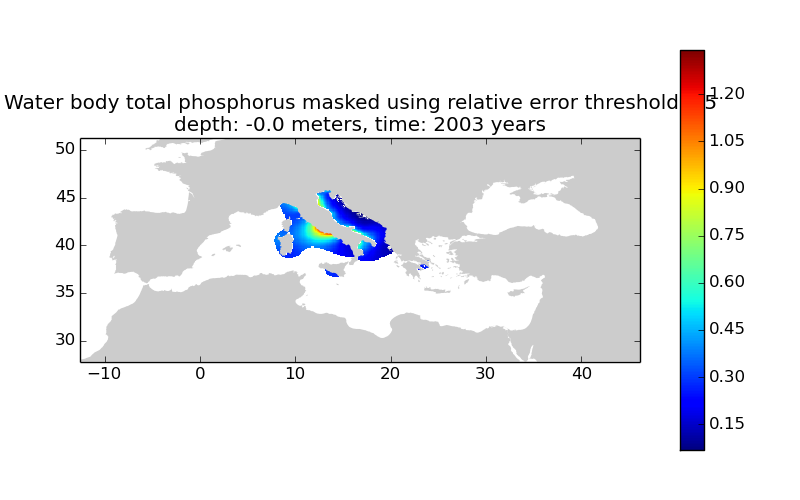
Moving 10-years analysis of total phosphorus at Mediterranean Sea for each season : - winter (January-March), - spring (April-June), - summer (July-September), - autumn (October-December). Every year of the time dimension corresponds to the 10-year centered average of each season. Decades span from 1984-1993 until 1998-2007. Observational data span from 1978 to 2013. Depth range (IODE standard depths): -1000.0, -900.0, -800.0, -700.0, -600.0, -500.0, -400.0, -300.0, -250.0, -200.0, -150.0, -125.0, -100.0, -75.0, -50.0, -30.0, -20.0, -10.0, -5.0, -0.0. Data Sources: observational data from SeaDataNet/EMODNet Chemistry Data Network. Description of DIVA analysis: Geostatistical data analysis by DIVA (Data-Interpolating Variational Analysis) tool. Profiles were interpolated at standard depths using weighted parabolic interpolation algorithm (Reiniger and Ross, 1968). GEBCO 1min topography is used for the contouring preparation. Analyzed filed masked using relative error threshold 0.3 and 0.5. DIVA settings: A constant value for signal-to-noise ratio was used equal to 3. Correlation length was optimized and filtered vertically and a seasonally-averaged profile was used. Logarithmic transformation applied to the data prior to the analysis. Background field: the data mean value is subtracted from the data. Detrending of data: no. Advection constraint applied: no. Originators of Italian data sets-List of contributors: o Brunetti Fabio (OGS) o Cardin Vanessa, Bensi Manuel doi:10.6092/36728450-4296-4e6a-967d-d5b6da55f306 o Cardin Vanessa, Bensi Manuel, Ursella Laura, Siena Giuseppe doi:10.6092/f8e6d18e-f877-4aa5-a983-a03b06ccb987 o Cataletto Bruno (OGS) o Cinzia Comici Cinzia (OGS) o Civitarese Giuseppe (OGS) o DeVittor Cinzia (OGS) o Giani Michele (OGS) o Kovacevic Vedrana (OGS) o Mosetti Renzo (OGS) o Solidoro C.,Beran A.,Cataletto B.,Celussi M.,Cibic T.,Comici C.,Del Negro P.,De Vittor C.,Minocci M.,Monti M.,Fabbro C.,Falconi C.,Franzo A.,Libralato S.,Lipizer M.,Negussanti J.S.,Russel H.,Valli G., doi:10.6092/e5518899-b914-43b0-8139-023718aa63f5 o Celio Massimo (ARPA FVG) o Malaguti Antonella (ENEA) o Fonda Umani Serena (UNITS) o Bignami Francesco (ISAC/CNR) o Boldrini Alfredo (ISMAR/CNR) o Marini Mauro (ISMAR/CNR) o Miserocchi Stefano (ISMAR/CNR) o Zaccone Renata (IAMC/CNR) o Lavezza, R., Dubroca, L. F. C., Ludicone, D., Kress, N., Herut, B., Civitarese, G., Cruzado, A., Lefèvre, D., Souvermezoglou, E., Yilmaz, A., Tugrul, S., and Ribera d'Alcala, M.: Compilation of quality controlled nutrient profiles from the Mediterranean Sea, doi:10.1594/PANGAEA.771907, 2011.
-
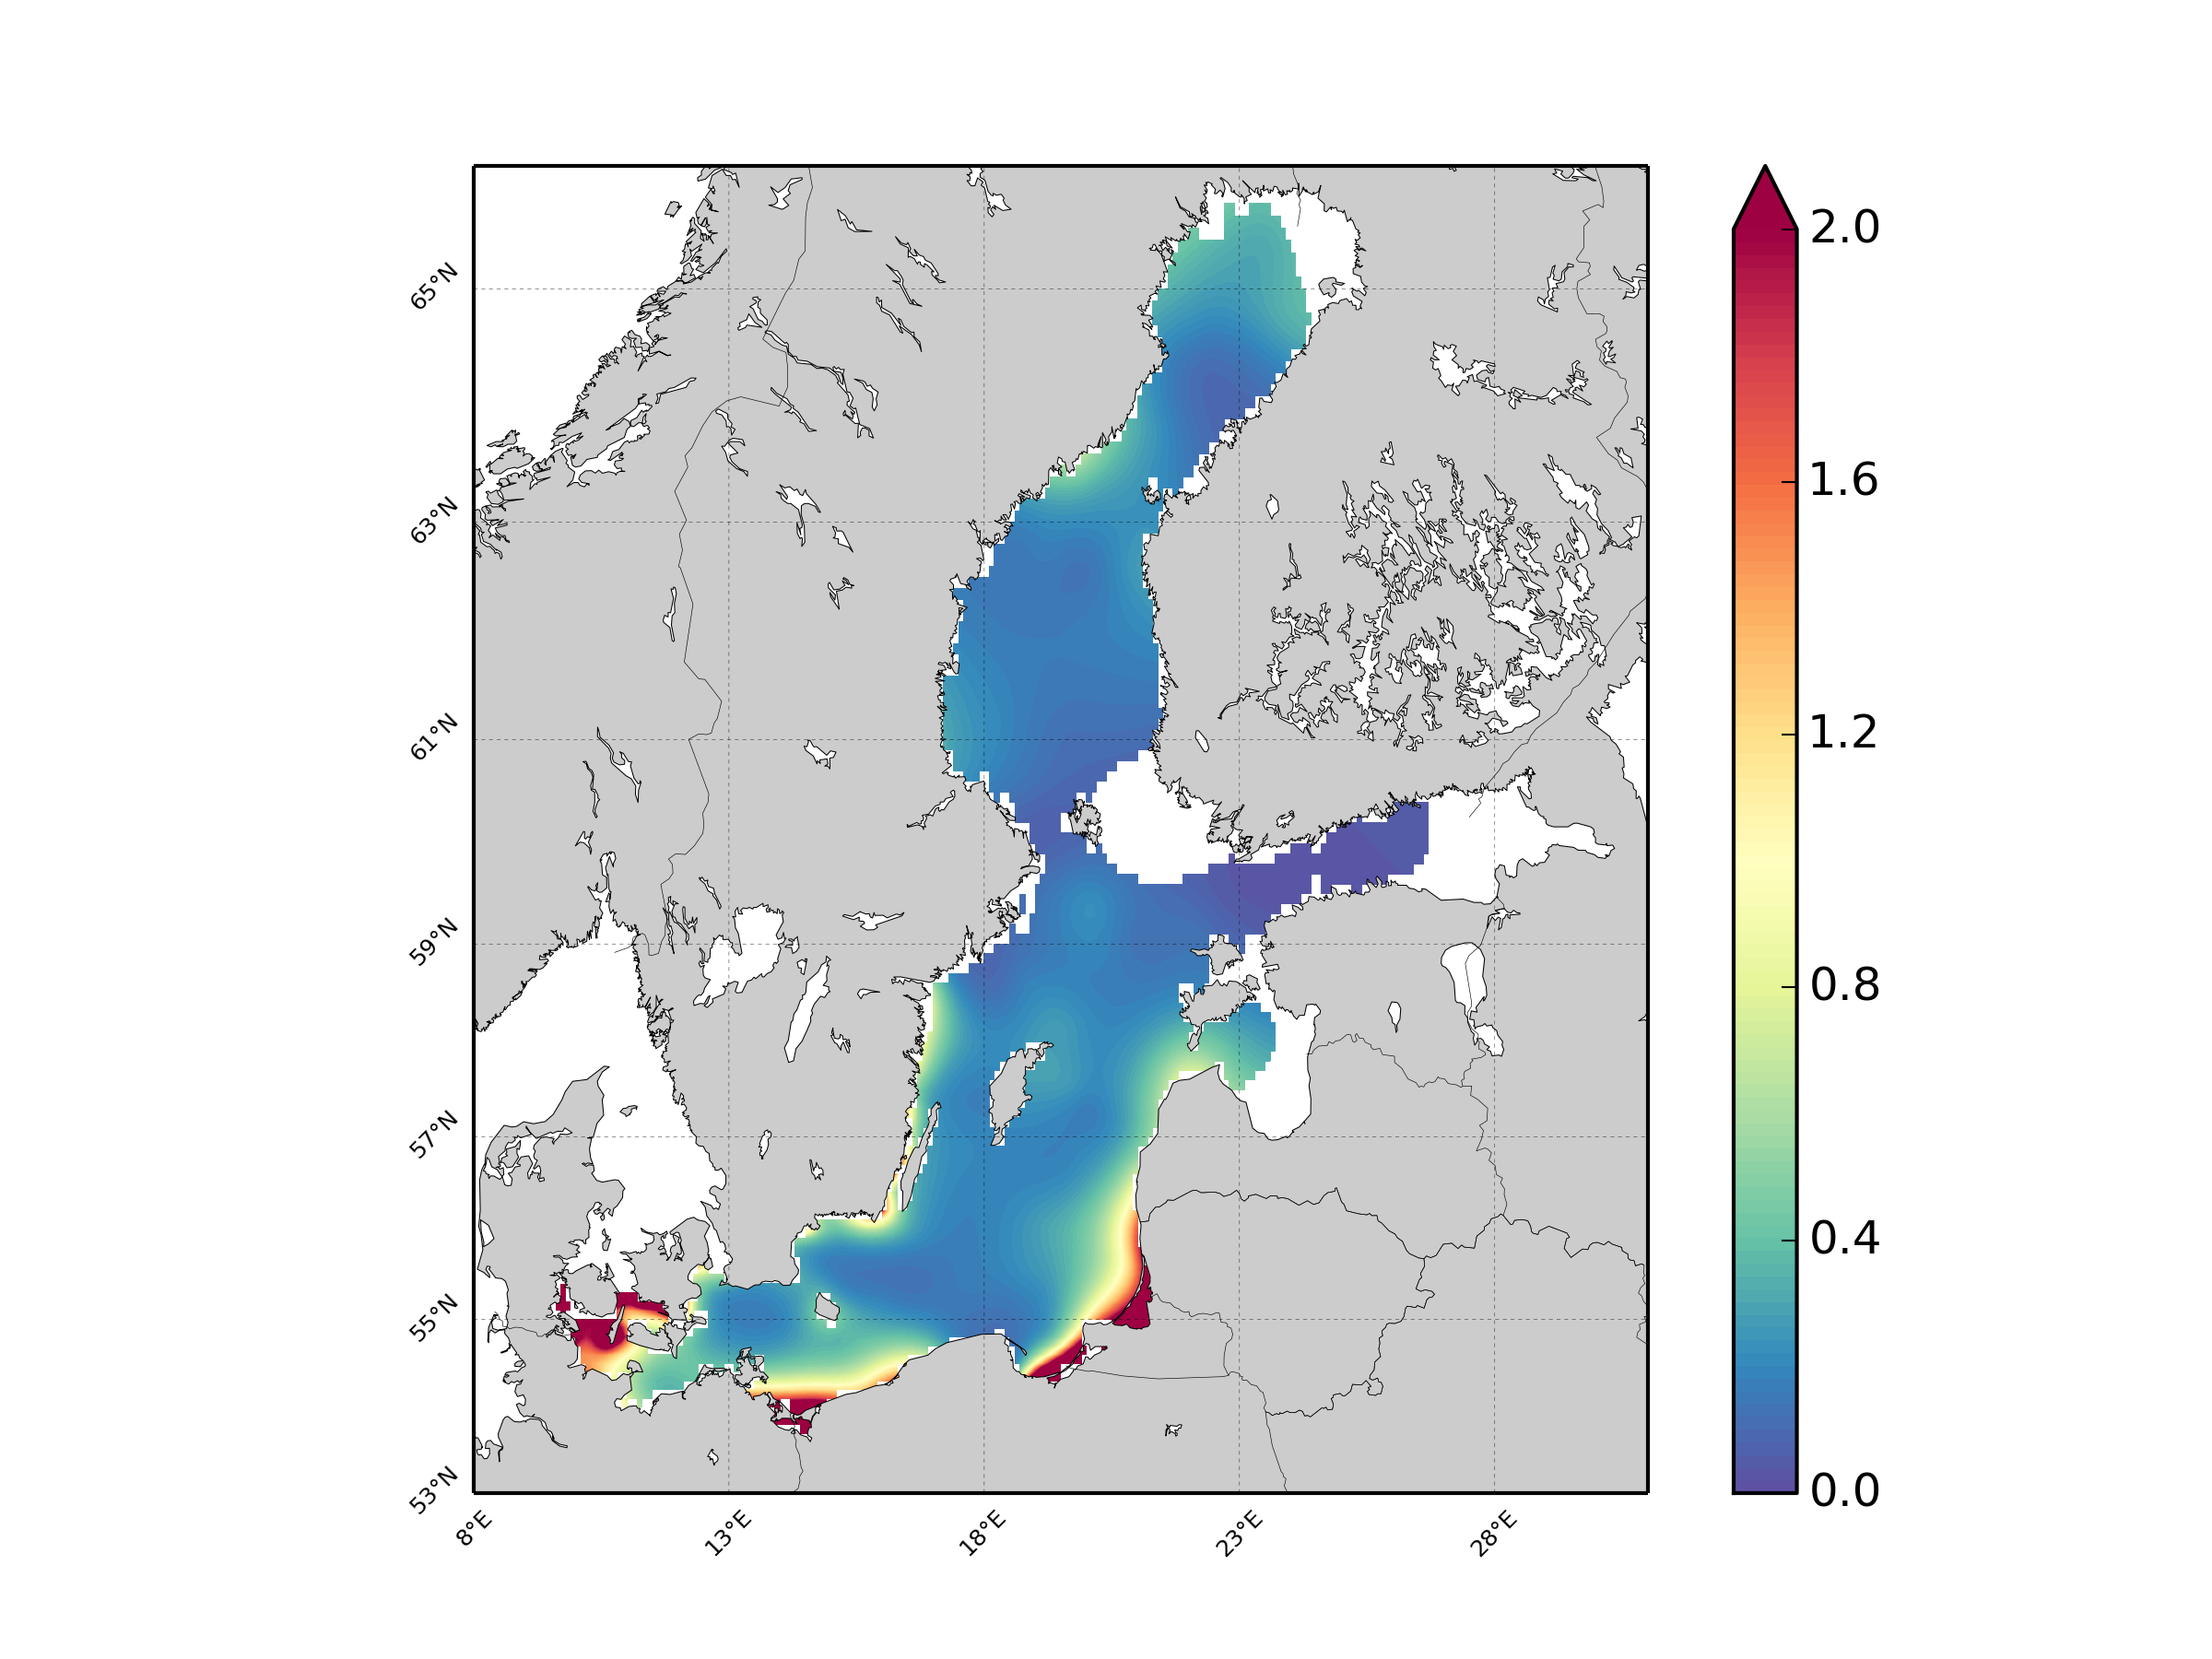
Units: umol/l. Method: spatial interpolation produced with DIVA (Data-Interpolating Variational Analysis). URL: http://modb.oce.ulg.ac.be/DIVA. Comment: Every year of the time dimension corresponds to a 10-year centred average for each season : - winter season (December-February), - spring (March-May), - summer (June-August), - autumn (September-November). Diva settings: Snr=1.0, CL=0.7
-
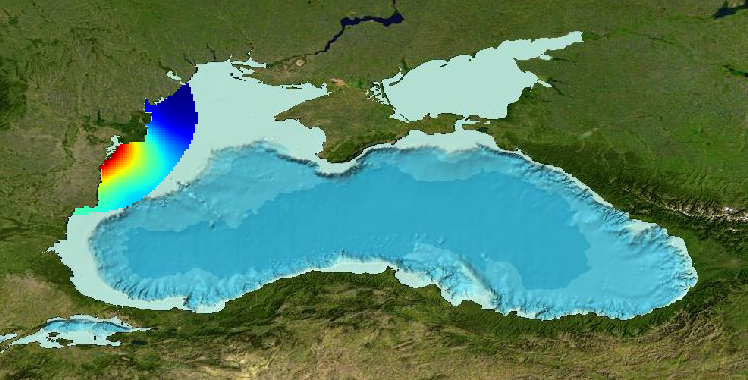
Gridded product for visualization of Water body chlorophyll-a in the Western part of Black Sea generated by DIVA 4.6.11 using all EMODNET Chemistry data from 2000 to 2014. Depth range (IODE standard depths): 0, -5, -10, –20m. DIVA settings: signal-to-noise ratio and correlation length were estimated using data mean distance as a minimum (for L), and both parameters vertically filtered. Background field: the data mean value is subtracted from the data. Detrending of data: no. Advection constraint applied: no. Analysis: logaritmic transformation. Every year of the time dimension corresponds to a 10-year centred average for each season: - winter: December - February, - spring: March - May, - summer: June - August, - autumn: September - November Units: mg/m^3
-
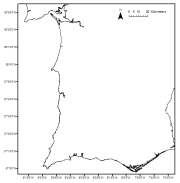
Cymodocea nodosa meadows distribution in the south of Portugal from historical data. Data provided by the Life Project BIOMARES and published in: ÔÇ£Seagrasses in Portugal: A most endangered marine habitatÔÇØ. Aquatic Botany. doi:10.1016/j.aquabot.2011.08.007. ÔÇ£Estimation of available seagrass meadows area in Portugal for transplanting purposes ÔÇØ. Journal of Coastal Research (2009) :SI 56 (1100-1104)
-
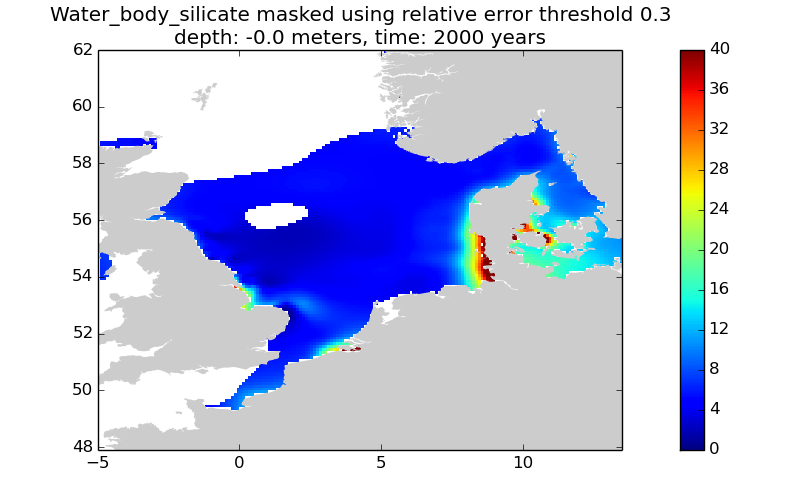
This gridded product visualizes 1960 - 2014 water body silicate concentration (umol/l) in the North Sea domain, for each season (winter: December – February; spring: March – May; summer: June – August; autumn: September – November). It is produced as a Diva 4D analysis, version 4.6.9: a reference field of all seasonal data between 1960-2014 was used; results were logit transformed to avoid negative/underestimated values in the interpolated results; error threshold masks L1 (0.3) and L2 (0.5) are included as well as the unmasked field. Every step of the time dimension corresponds to a 10-year moving average for each season. The depth dimension allows visualizing the gridded field at various depths.
-
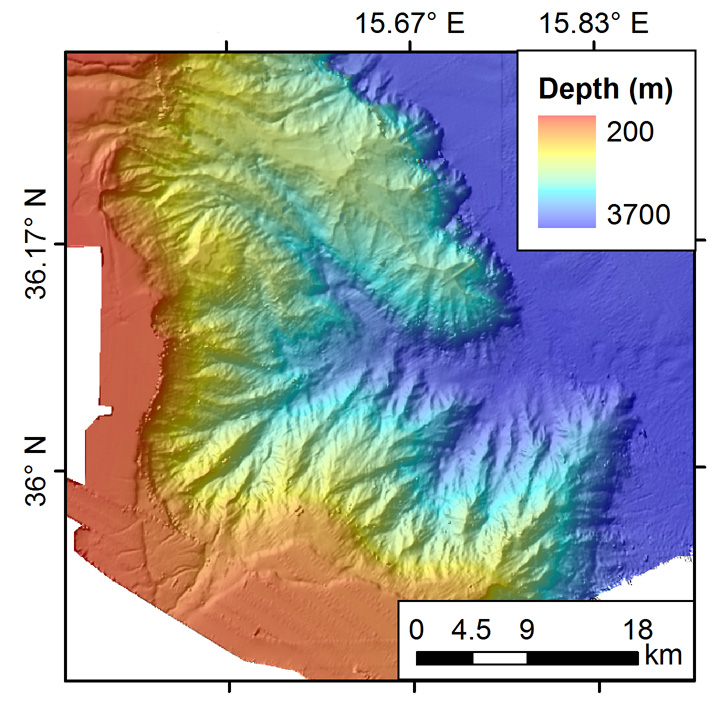
The data were acquired with a Simrad EM710 Multi Beam echosounder onboard the R/V Urania in order to cover the outer Malta Plateau and upper Malta Escarpment for a geological survey in the framework of EU FP7 project EUROFLEETS. The data were published in: Micallef, A., Georgiopoulou, A., Le Bas, T., Mountjoy, J.J., Huvenne, V., Lo Iacono, C., 2013. The Malta-Sicily Escarpment: Mass Movement dynamics in a sediment-undersupplied margin, in: Krastel, S., Berhmann, J.H., Volker, D., Stipp, M., Berndt, C., Urgeles, R., Chaytor, J.D., Huhn, K., Strasser, M., Harbitz, C.B. (Eds.), Submarine Mass Movements and Their Consequences. Springer International Publishing, Switzerland, pp. 317-328.
-
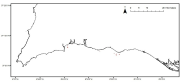
Maerl beds distribution in the Portuguese mainland from historical data. Data published in: ÔÇ£Present distribution of maerl beds in the Atlantic Iberian PeninsulaÔÇØ. Museologia Scientifica e Naturalista. Volume Speciale 2009
-
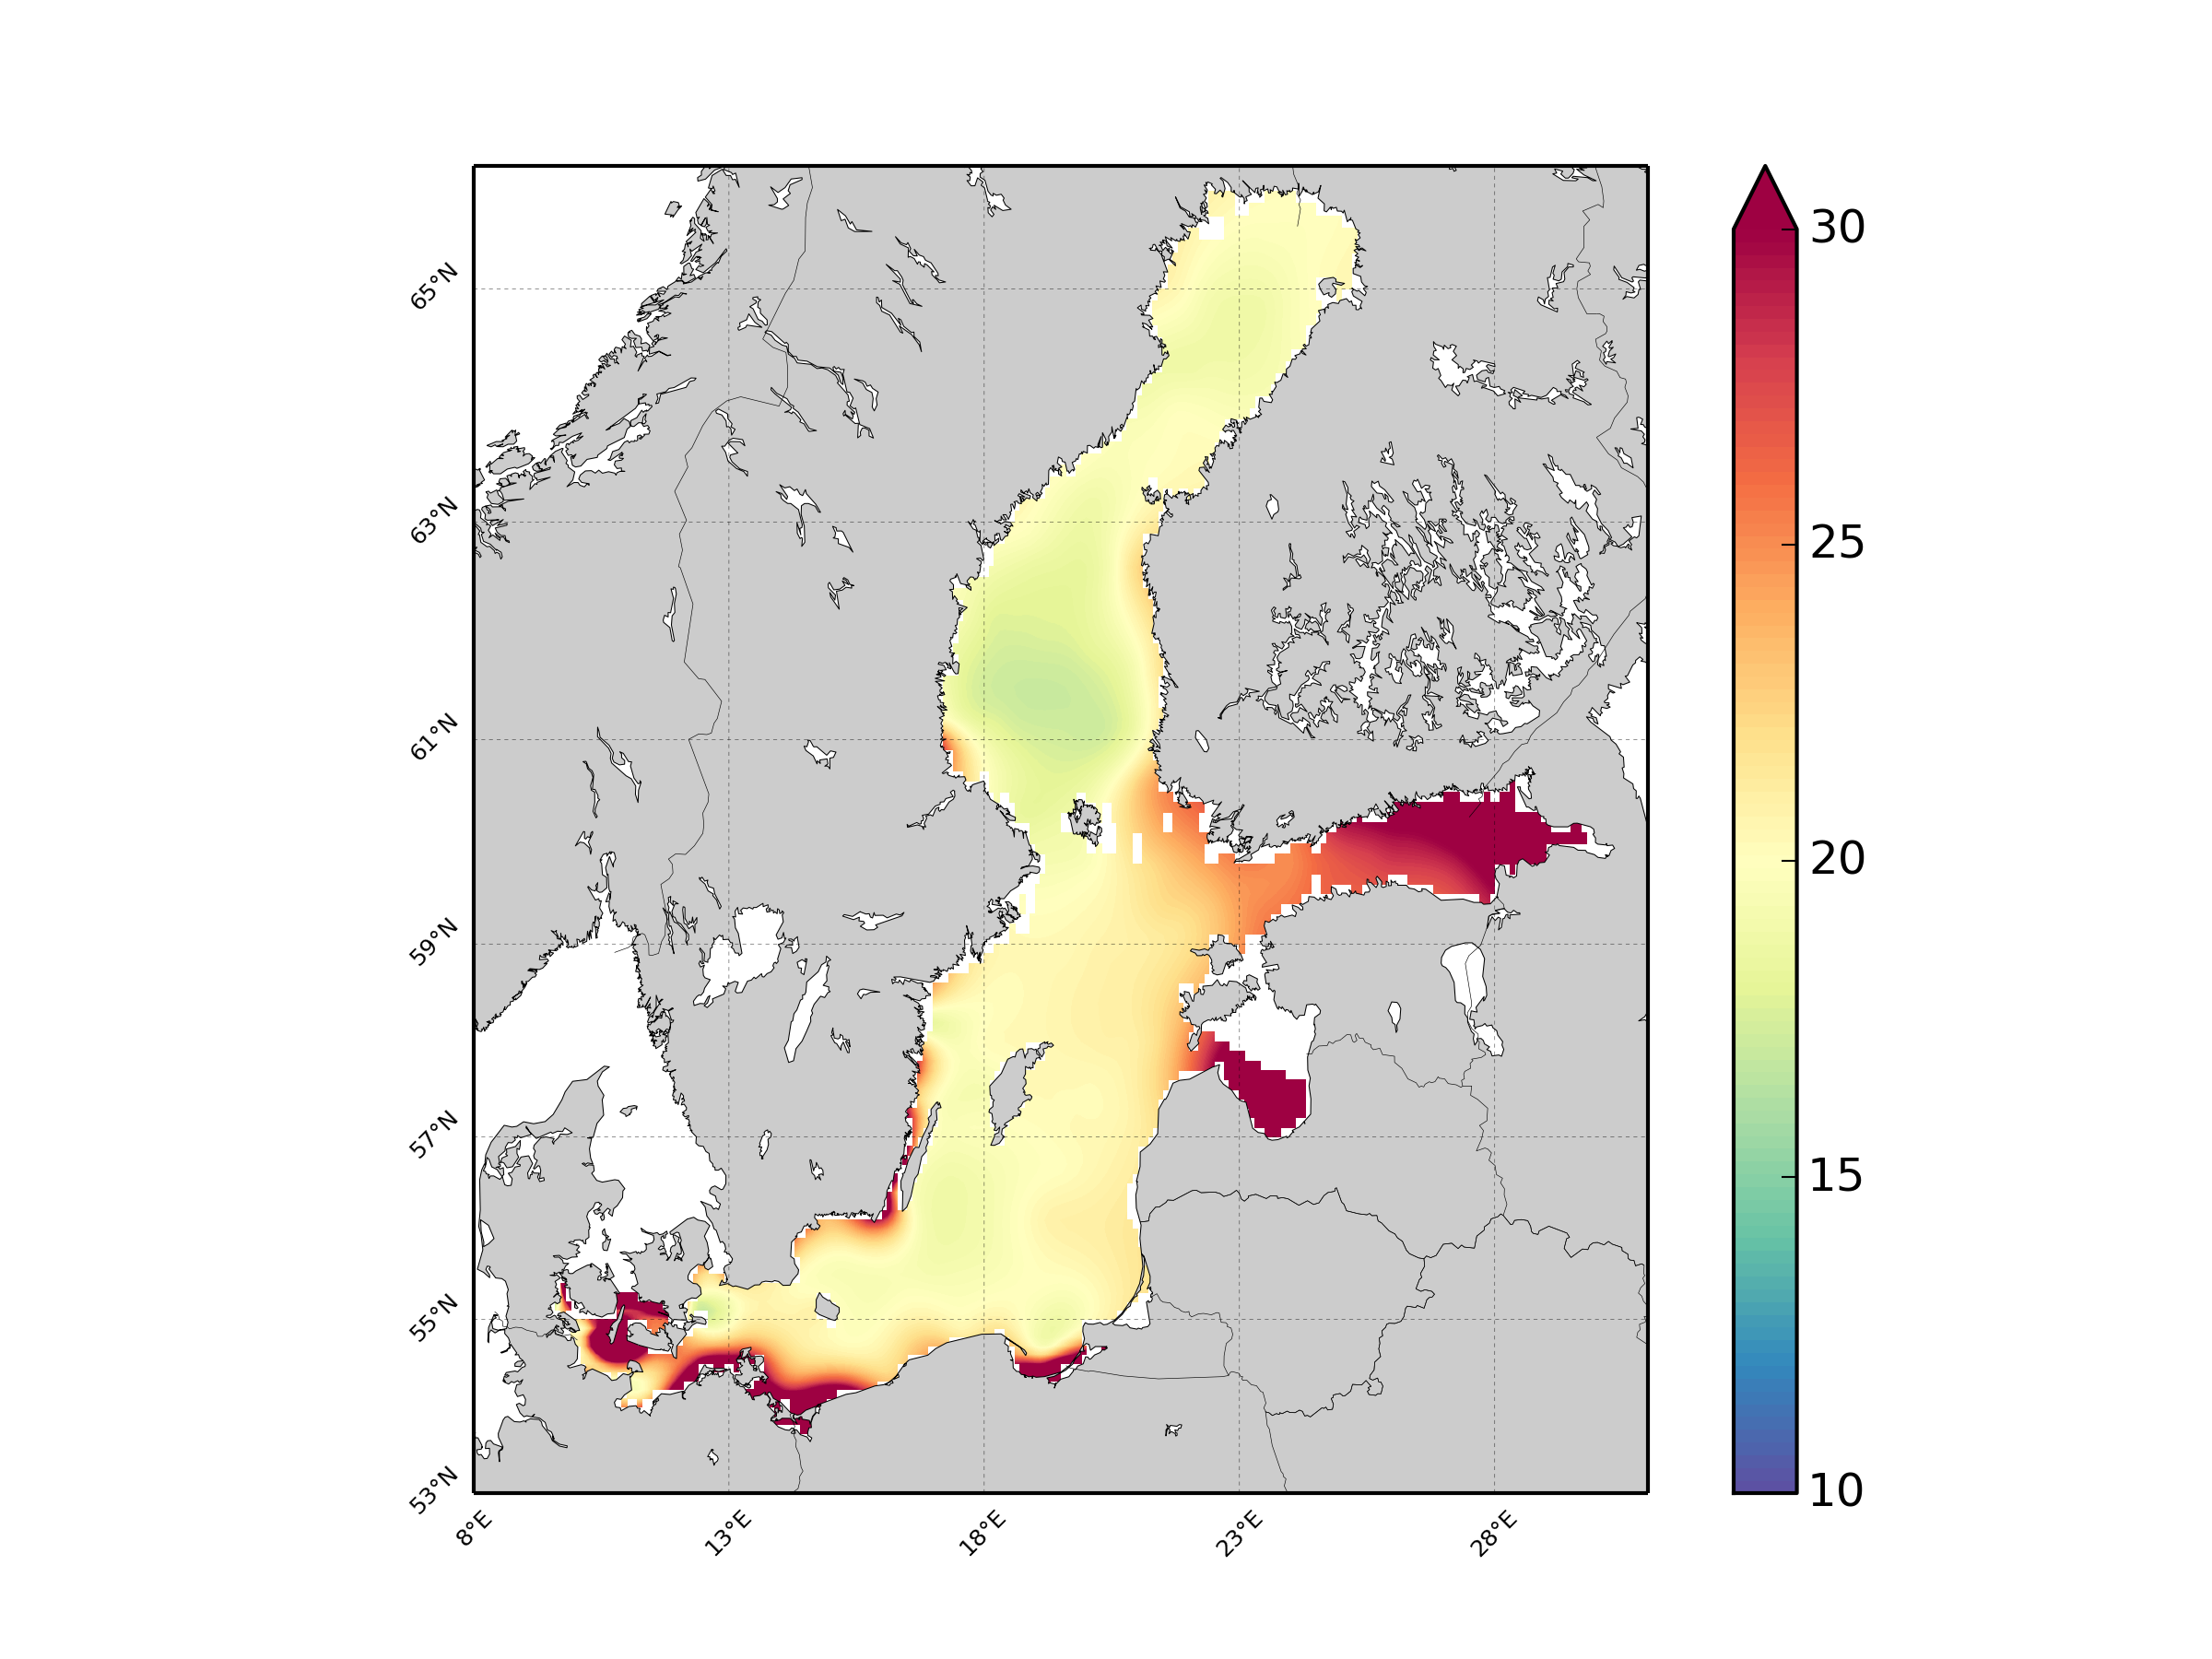
Units: umol/l. Method: spatial interpolation produced with DIVA (Data-Interpolating Variational Analysis). URL: http://modb.oce.ulg.ac.be/DIVA. Comment: Every year of the time dimension corresponds to a 10-year centred average for each season : - winter season (December-February), - spring (March-May), - summer (June-August), - autumn (September-November). Diva settings: Snr=1.0, CL=0.7.
-
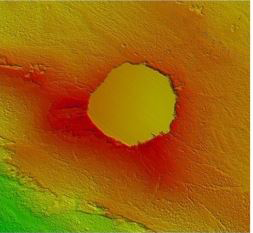
The data were acquired with a Simrad EM3002-D Multi Beam echosounder onboard the R/V Hercules as part of a habitat mapping survey in the framework of RICS funded project. The data were published in: Micallef, A., Le Bas, T.P., Huvenne, V.A.I., Blondel, P., Hühnerbach, V., Deidun, A., 2012. A multi-method approach for benthic habitat mapping of shallow coastal areas with high resolution multibeam data. Continental Shelf Research 39-40, 14-26.